It is difficult for a researcher to gather data from the entire population he is studying, for this reason he needs to have a significant research sample.
Defining the sample is one of the most important phases of the investigation. Only after specifying the sample can the student select the methods and techniques and test the instruments and procedures that will be used in data collection.
What is a research sample?
Before introducing the definition of sampling, you need to understand what a population is.
A population is a set of elements or individuals that share common characteristics. It can be finite or infinite.
The number of schools present in the city of Curitiba is finite, since the number of zooplankton in the oceans can be classified as infinite.
According to Lakatos and Marconi (2003, p.163), “the sample is a conveniently selected portion of the universe (population); is a subset of the universe.
Scholars defend the idea that the larger the sample analyzed, the greater the inductive strength of the argument.
Sampling types
probability sample
Sampling is considered probabilistic when all elements of the population have a known probability of belonging to the subset analyzed in the survey. Selection is random and unbiased, with rigorous scientific methods.
Each sampling unit – which can be an individual, a family, a school or a community – has the same probability of being selected. The probabilistic research sample is the most recommended type to have a real representativeness of the studied universe.
simple random sample
The simple survey sample, also known as the random sample, works like a lottery draw. In this technique, all sampling units have the same chances of belonging to the subset analyzed in the research.
The sampling method requires: numbering the individuals that make up the studied population and drawing lots.
Example:
systematic sample
In the case of a homogeneous population, this technique advocates that elements are identified by position. The definition of a sampling unit is made periodically. There is a pattern of choice, a system.
- Calculate the ratio R = N/n, where N is the population size and n is the survey sample size.
- Draw a number between 01 and R.
- To obtain the sample, calculate: drawn number, drawn number + R, drawn number + 2R, drawn number + 3R.
Did not understand? Consider the example below:
The researcher must take the customers’ chips, from 1 to 20, and draw one person. Suppose the number drawn was 12.
Sample = 12 (+20), 32 (+20), 52 (+20), 72….
stratified sample
There is a concern to divide the target population into groups (strata), considering the important characteristics for the research. Afterwards, the individuals that make up each group are randomly selected.
Different criteria can be put into practice to define a stratum, such as age, income and education.
There are three types of stratified sampling:
- Uniform: the same number of elements is drawn for each stratum.
- Proportional: the number of draws from each stratum is proportional to the number of elements in the subgroup.
- Optimal: the proportion is respected not only in the number of elements, but also in the variation of the variable.
Example:
Sample by clusters
The population can be subdivided into groups, which are called clusters. In this case, it is interesting to apply a sampling technique in each group through drawing lots. The method seeks practicality and economy. Here, the sampling unit becomes a group of individuals.
Example:
multi-stage sample
The method is divided into two or more stages. At each stage, the researcher can apply one of the sampling methods presented in the previous topics. It is recommended for large scale studies.
Example
Non-probabilistic sample
In the non-probabilistic sample, the elements that make up the sample are chosen based on the researcher’s criteria.
convenience sample
Also known as accessibility sampling, it is the least rigorous of all sample types. The researcher obtains information in a faster and simpler way, according to the resources he has access to.
Example:
intentional sample
In this case, the sampling units are intentionally and subjectively selected, always respecting the characteristics of the studied universe. It is a method with a high chance of failure, as the researcher can be guided by pre-judgment.
Example:
Survey sample size
The definition of the sample size should take into account three factors:
- Confidence level: the larger the sample size, the greater the credibility of the study;
- Maximum error allowed: the smaller the margin of error, the larger the sample size;
- Variability: the more variable, the larger the sample size should be.
Non-sampling and sampling error
Quantitative research is subject to problems, which can be non-sampling and sampling.
Non-sampling error occurs when data is collected incorrectly or when the collection instrument is faulty. In addition, in the case of applying a questionnaire with biased questions, there is also a non-sampling error.
The sampling error is the difference between the sample result and the true result of the total population. In general, the larger the sample, the smaller the margin of error.
sample calculation
The ideal sample is based on calculations. Check out the basic formula below:
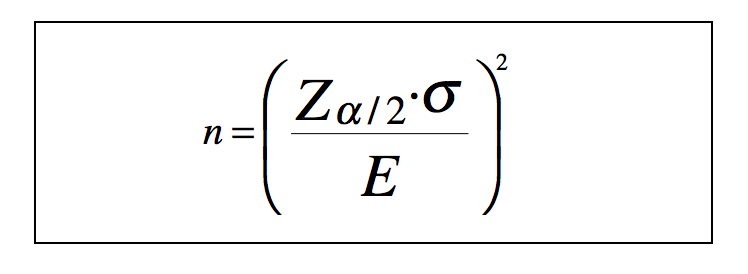
Where:
- n = sample size;
- Zα/2 = desired confidence level;
- σ = population standard deviation of the evaluated variable;
- E = margin of error;
- ɛ = sampling error.
Important: The most commonly used confidence level is 95%. In this case, the margin of error is 5%.