What is Ishikawa Diagram?
In this piece of information we will make you known about Ishikawa diagram example its origin making and steps for building.
The Ishikawa Diagram provides a systematic view of several areas of the company, contributing to a quick identification of problems and facilitating decision-making, while optimizing processes.
In your company, has it ever happened that employees spend hours trying to find the root of a problem? Despite being a multifaceted issue, relying on the Ishikawa Diagram certainly speeds up this process.
Quickly identifying the issues that are affecting the company’s strategic results avoids losses and also friction between teams. But for this to be done more precisely than hunches and intuition, we are going to present you with a very efficient methodology.
Through the Ishikawa diagram, also known as Cause and Effect Diagram or Fishbone Diagram, it is possible to involve the entire team using a standardized method to seek solutions.
The Ishikawa Diagram is a visual tool that helps in identifying the main causes of a problem, and is often implemented in process quality control processes.
Through them, the employees involved in the task are able to analyze all the factors involved in a given process, thus raising the main bottlenecks and points to improve.
Something to be clear about is that it doesn’t always have to be a problem, the effect can be any undesired behavior or outcome that you want to remedy before it becomes a bigger issue, such as absenteeism or customer complaints.
You will also find this methodology described with different names, but regardless of the nomenclature, the way to apply and the objective are the same: to get to the real causes of problems in organizational processes.
When and who should use it: understand how the methodology is applied by corporations
In general, the Ishikawa Diagram is used as a way to analyze any unwanted situation or non-compliance in the company.
Practical examples of its application is when you have products with defects or processes that are not generating the desired result.
It is a tool that helps managers and employees to have a global understanding of the situation, offering a simple and useful view of cause and effect.
Thus, the main uses in problem mapping happen as follows:
- visualize and understand the causes of a problem;
- expand the view of the causes of a problem, providing a more systematic view;
- identify solutions based on available resources;
- identify points of improvement in processes.
Something managers should keep in mind when adopting the Ishikawa Matrix is that it is not just for organizational issues, as we mentioned earlier, even the constant delays of an employee can be addressed in this way. Thus, even the HR team can take advantage of this methodology.
Thus, it is very useful during the decision-making process and drives the continuous improvement of processes, especially if associated with other management tools .
The Origin of the Ishikawa Diagram
Now that you understand what the Ishikawa Chart is and how it is applied within the corporate environment, let’s talk a little about its history.
As you can imagine, the name of the methodology comes from its creator, who was called Kaoru Ishikawa, an engineer who developed a tool with the objective that it could be used by anyone, from employees on the “factory floor” to the board of directors.
Since 1943, the year of its creation, the methodology has gained increasing popularity, as it helped employees from different areas to evaluate their processes and resolve issues that affect the organization’s productivity .
How to make an Ishikawa Diagram
We come to the practical part of this text, we will teach you how to apply the Fishbone Diagram in practice, helping you to identify the primary cause of problems.
But before going into these details, we need to explain why this methodology is also known as the 6M Diagram. Yes, there are several names, but once you finish this text you will understand why all of them and you will not get confused.
1-Understand what the 6Ms of the Diagram are
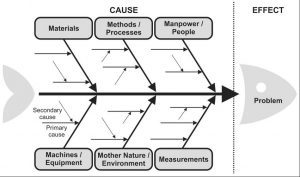
This name comes from the fish bones, see, each of them represents a possible cause of the effect (problem) being analyzed. Each of them starts with the letter M and there are 6 in total.
Below, you will understand what each of these items is and how to determine them.
1. Method
The methodology behind the process can be the cause of numerous issues within an organization, so this M aims to understand how the way the work is developed influences the problem.
2. Machine
Machine certainly refers to factories, but for application in other contexts, this point of analysis can be interpreted as tools used to execute processes.
Here it can be from lack of maintenance to not paying for the license of a program essential for production or lack of skills to manage it.
Thus, it is possible to raise issues such as lack of training or the need for new hires .
3. Measure
This point refers to the analysis of process indicators that are used by managers for decision making.
Are they aligned with the purpose of the activities? Is it necessary to review them? It is at this point that we will study how the measures used influence the problem.
4. Environment
What is the context in which employees are inserted? Does the organizational climate of the company influence the emergence of problems?
In addition to the company itself, external factors can also be evaluated such as excessive heat, rain, etc.
5. Material
Understanding how the materials used to manufacture a product or provide a service can impact its quality is important.
At this point, contributors investigate how they might be linked to the issue at hand.
6. Labor
Now we assess the human factor in the problem, how did the people involved in the project contribute to its emergence?
Here, numerous issues can be raised such as demotivation, tiring work routine, failures in the operation. If these are the cases, the feedback culture can help the manager identify the issues and, with the help of HR, plan interventions.
2-The 4Ms Diagram
Every company is unique and the 6Ms will not always apply. For example, not all projects need to consider the Ms of measurement and environment.
That way, you can customize and focus on what might actually be causing the problem. But be aware, only discard an “area” if you are sure that it does not influence the problem.
Keep in mind that each M also serves as a provocation for employees to raise issues that may have gone unnoticed by the manager.
Without further ado, let’s get down to business and understand how to prepare an Ishikawa diagram.
Step by step to build an Ishikawa Diagram
We have already talked about what the Ishikawa Diagram is, its main applications and also some important concepts to run it and find the root of business problems.
Step 1: Define the problem
Before beginning any analysis it is necessary to understand what is being dissected. Thus, the more specific, the simpler it will be to measure how all the areas involved influence the issue.
Step 2: Create the fishbone
Start by drawing a horizontal line and at one of its ends, write the problem being treated.
After that, draw 4 or 6 perpendicular vertical strokes, each of these strokes will be one of the Ms we discussed earlier; the amount will depend on the factors being analyzed.
Step 3: Analyze the causes with the team
The problem has been defined and the framework is ready, now it’s time to bring in all involved contributors to engage in resolving the issue.
The idea is that this meeting works as a brainstorm with a guiding question: why did a certain problem happen?
Step 4: Divide into subgroups
As the answers appear, write on the “pimples”. It is interesting to do this in a way that everyone can follow the process.
An example of this is a factory that manufactures tires encountered a problem with a specific batch. During the analysis, issues such as lack of employees and quality of the rubber used emerged, these issues are under the mantle of labor and raw material respectively.
Step 5: Highlight the root cause
An error rarely has just one cause, however, there is always the one that contributes the most. So, when they come to the conclusion about what the main cause was, highlight it and start the next step.
It is common to choose the most obvious option right away, here it is important to analyze different alternatives before making a decision.
Step 6: Plan actions
It is now that the manager puts the creativity of the employees to work: how to solve the main cause of the problem?
Here it is important to create an action plan, define those responsible and set deadlines for resolving the issue.
What are the benefits of the Cause and Effect Diagram for the organization?
Understand now how implementing this methodology will help your company to achieve the expected results, correcting problems before they become real nightmares.
1-Systemic view of the causes
Often employees and managers get used to only looking at their performance and forget that good results depend on cooperation between different employees and even sectors of the company.
When applying this methodology to identify the causes of something unwanted, everyone is obliged to deliberate on how these factors can best work together.
2-Engage the team in problem solving
The Ishikawa Diagram is efficient precisely because it involves the entire team, in other words, individuals from different stages of production interact to solve something.
In addition to encouraging teamwork, employees also feel heard by the company, as the manager involves them directly in the process.
3-Stimulates constant process improvement
Regardless of the problem, the diagram encourages constant process optimization. And even if they are currently aligned with the company’s routine, just the act of constantly evaluating them already creates a more critical view of what can be improved.
This can have several other impacts, such as increased productivity and even employee motivation.
4-Prioritize the most important issues
When the root cause of a problem is not understood, attempts to correct it can be directed at factors with a lower level of relevance than the real reason.
That is why this methodology has become so widespread, through which it is possible to prioritize corrective actions according to their impact on the desired result .
Examples of Ishikawa Diagram
To make the execution of the Ishikawa Methodology even clearer, we have prepared some examples so that you understand how to fill in each field.
1. Defective products
Problem: defective products
- Method: undocumented procedures
- Workforce: insufficient training; team demotivation
- Material: inadequate storage of raw material
- Measure: there is no quality control in production
- Environment: excessive heat on the shop floor
- Machine: excess maintenance; lack of calibration
Realize that several aspects can be correlated, for example, excessive heat can be a reason for team demotivation.
2. Constant employee delays
Problem: Employee always late
- Method: distance from work, drop off kids at school
- Workforce: fatigue
- Measure: recent time change
- Environment: traffic jam, rain
- Machine: fuel the car