The variance or variance is a measure of the dispersion of a random variable (values that are obtained randomly). It is widely used in the area of statistics expressing, through a number, the variability of said dispersion. What is variance in statistics?
Ronald Fisher, an English mathematician, physicist, biologist, and statistician, was the first to introduce the term variance in 1918 in one of his published studies on biometrics. In turn, he introduced studies on the analysis of variance.
What is the Variance?
The variance of a sample or of a set of values is the sum of the squared deviations with respect to the average or the mean, all this divided by the total number of observations minus 1.
In a very general way, it can be said that the variance is the standard deviation squared.
In the areas of economics and finance, the variance is interpreted as the risk that the return performed in some procedure is different from the expected return. Usually when a higher return is expected, the risk in turn is higher.
Variance as a measure of dispersion
The variance, along with the standard deviation, are measures of dispersion of data or observations. The dispersion of these data indicates the variety that these present, that is, if all the values in a data set are equal, then there is no dispersion, but instead, if they are not all equal then there is dispersion. What is variance in statistics?
This dispersion can be large or small, depending on how close the values are to the mean.
The variance of a sample is symbolized as S 2 , while the variance of a population is symbolized as σ 2 .
The variance of a sample is used to estimate the variance of a population, which is often unknown. This is why S 2 is also commonly considered as a statistic and σ 2 as a parameter.
Variance Formula
The variance of a sample has the following formula:
S 2 =
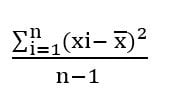
Where, represents the sum of the subtraction between each of the sampled values () and the mean, squared.
In turn, it represents the total number of observations or data sampled. For very large values the variance is minimal or even negligible. What is variance in statistics?
Instead, the variance of a population has the following formula:
σ 2 =
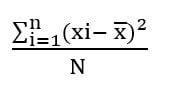
Where N represents the total number of observations or data sampled.
In most cases it is very difficult, if not impossible to obtain a total N of data, for example, when talking about individuals from a population, it is not possible to sample all these individuals, since there is a factor of time and resources limiting. What is variance in statistics?
This is why statistics are often used to estimate the parameters of a population. According to the way this formula is written, the units of the variance have the same units of the variable, but squared.
Also, we see that the variance cannot be negative, so the minimum value that can be obtained in it is zero.
Standard deviation of a sample
Unlike variance, the standard deviation of a sample is represented as follows:
S =
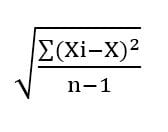
In this case, this measure does present the same units of the sampled variable.
Variance Example
To calculate the variance, you must first calculate the mean or average of the data used. On the other hand, if you have the standard deviation, you just square that result and get the variance.
Here is an example to understand how the variance is calculated and what could be its interpretation.
Suppose that we have the annual income of five different companies, belonging to the same entrepreneur, which are:
- Company A: $ 2,500
- Company B: $ 1,800
- Company C: $ 2,300
- Company D: $ 3,000
- Company E: $ 2,700
Then we calculate the average of the income, simply adding each figure and dividing it by the total number of companies, which gives as a result: $ 2,460. What is variance in statistics?
| Data | Average | Data – Average | ||
| Data 1 | 2500 | 2460 | 40 | 1600 |
| Data 2 | 1800 | 2460 | -660 | 435600 |
| Fact 3 | 2300 | 2460 | -160 | 25600 |
| Data 4 | 3000 | 2460 | 540 | 291600 |
| Data 5 | 2700 | 2460 | 240 | 57600 |
| Total | 812000 |
The population variance is the sum of the differences of the data with the squared average, divided by n, in this case it is 5.
812000/5 = 203000
σ 2 = 162400
Taking the square root of this result, we obtain the standard deviation, this being $ 402 difference between the revenues of the five companies.
Applications of this measure
The variance as a measure of dispersion has multiple applications in various areas, some of its utilities are:
- Represents an aid in making decisions about an investment (Also interpreted as the risk in an investment). If the variance or probability distribution of an investment’s returns is high, it may indicate an unfavorable investment. What is variance in statistics?
- To describe, analyze and understand the behavior of a variable over time.
- Allows you to make comparisons between different groups of data.
- It allows to analyze what would be the best decision that can be made. This through analysis of variance, for example, deciding between which method represents the best learning or deciding which investment would represent a greater income per year.
Conclusion
In the analysis of variances, the significant differences between two or more means of a sample are studied. This analysis is commonly known as ANOVA and it also allows us to determine if these means come from the same population (it can be the total number of employees of a company), or if the means of two populations are equal.
On the other hand, the variance as well as the standard deviation are very sensitive to outliers, these are the values that are very far from the mean or that are very different from it.
So that these measures are not so affected, these outliers can be ignored when performing analyzes and even calculations. Other measures of dispersion that are more useful in these cases can also be employed. What is variance in statistics?
In the case of analyzing the risk of an investment, two important aspects are taken into account, one is the invested return and the other is the expected one according to the investment made. As already mentioned, the variance can be used to analyze this risk.